
How to create a report in SugarCRM: The complete guide
If you’re a Sugar user, creating reports is a powerful way to gain insight into your customer data. From sales pipelines to email marketing lists, the reports function in Sugar offers robust tools to generate custom reports based on your specific needs.
In this blog, we will guide you through the steps to creating a report, the different report types and the top tips for best practices.
Before you start following along, it’s important to make sure you have the permissions to access the modules you need to report on. If certain options are restricted, you’ll need to ask your system administrator to allow access to you or your team.
Navigate to the Reports module
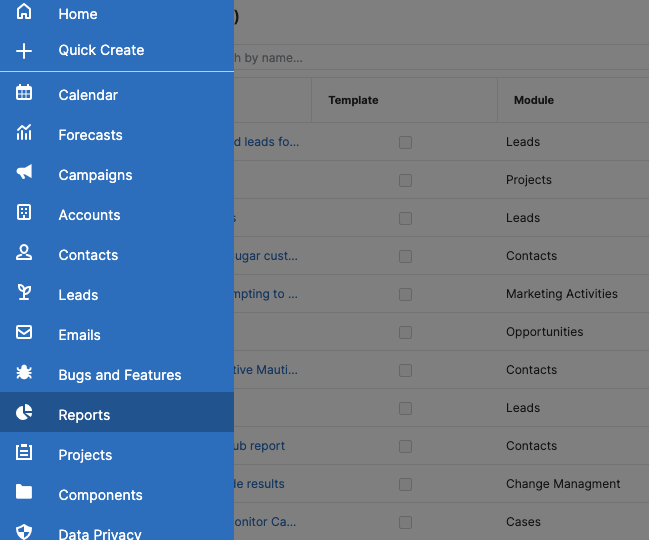
On the left-hand side of Sugar, select the ‘Reports’ module from the menu. Once opened, you’ll be able to access other team member’s reports and see the last time the report was run.
To create a new report from scratch, click ‘Create’.
Choose your report type
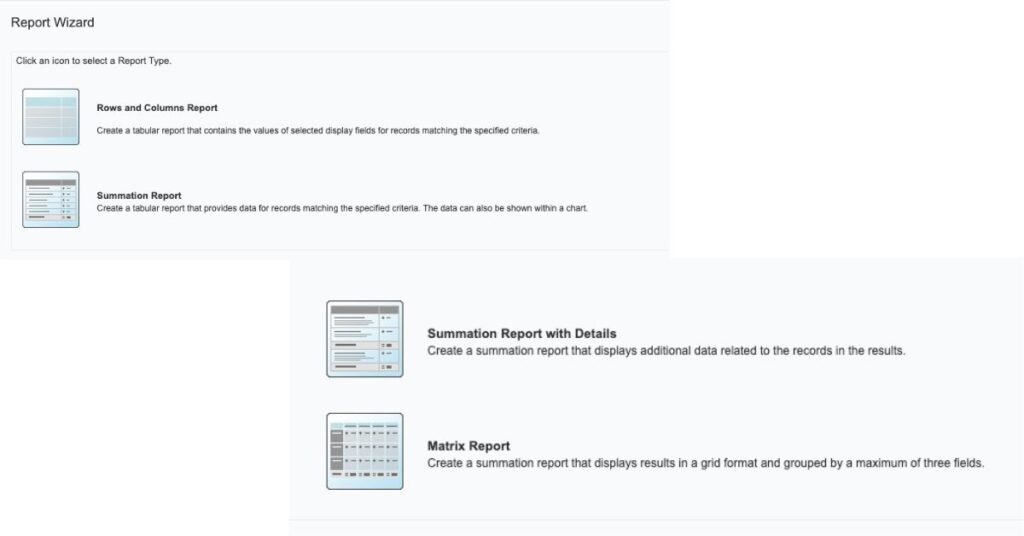
Sugar displays four standard report options to choose from. Depending on the type of report you’re creating, your choice may vary.
Rows and Columns Report – This report type is the most simple of them all. It is essentially a big Excel spreadsheet displaying the chosen fields. This option is great for marketing target lists to gather a group of customers from a specific location or industry for example.
Summation Report – A summation report displays a vibrant chart with grouped totals on the bottom. This could be used for sales and opportunity pipelines – perfect for those who prefer a more visual layout. Plus, you have the option to choose different chart formats (pie, treemap, funnel etc).
Summation with Details Report – A more enhanced version of a Summation Report. This report type displays the chart at the top of the view and grouped details at the bottom
Matrix Report – A matrix report is essentially a table of summed data, great for reporting on numbers/figures and generating a grand total.
Top Tip: It’s easier to report on dropdown and multi select fields. Text area fields can be reported on but the text used must be exactly the same on each instance for the report to recognise that they’re grouped. So, if you’re a system admin, making your fields dropdowns and multi selects will make it easier to report on your data.
Select a module
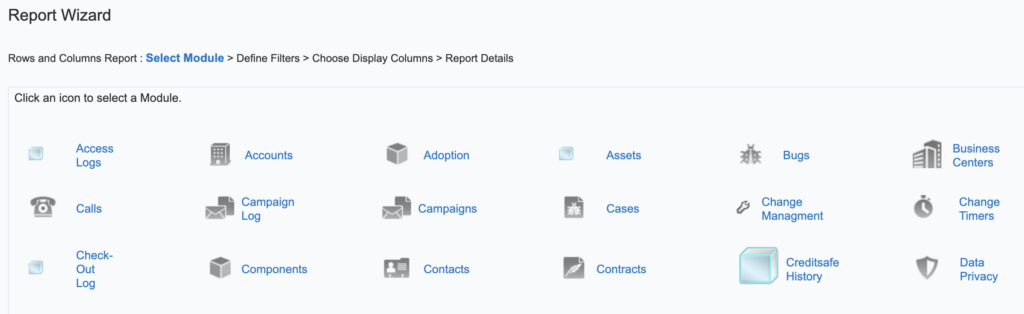
After you’ve selected your report type, a selection of Sugar modules will appear. Choose the module you want to report on. For example, if you want to report on the status of your leads, you would choose the Leads module. Or, if you wanted to create a target list for companies/accounts in a specific location, you would choose the Accounts module.
Define your filters and conditions
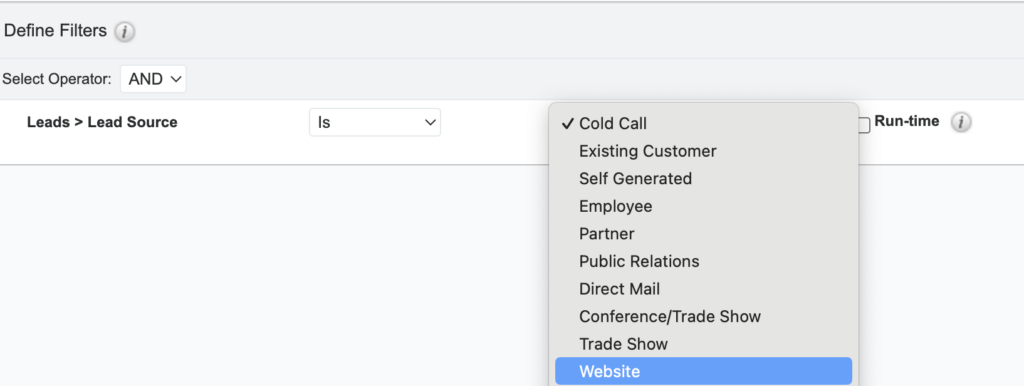
This is where things start to look a little complicated for a Sugar newbie. But don’t worry, mastering Sugar reports comes with practice. No matter which of the four report types you choose, defining your filters is always the first step.
Let’s say you want to create a Rows and Columns target list for Leads who have come from your website, under your Leads Fields, you would select Lead Source. Then, you would select “is” “website”. This will filter out the leads who have come from anywhere else.
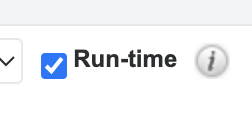
Top Tip: The Run time checkbox is more effective than it seems. If you tick the run time checkbox, you can change the filters without having to go back in and edit the report. So, after you’ve saved the report, you’ll have the option to change the filters.
Now this is where things start to get a bit different depending on the report type you’ve chosen. So, let’s go through them one by one, and the different steps that will follow.
Rows and Column Report Next Steps
Select your display fields
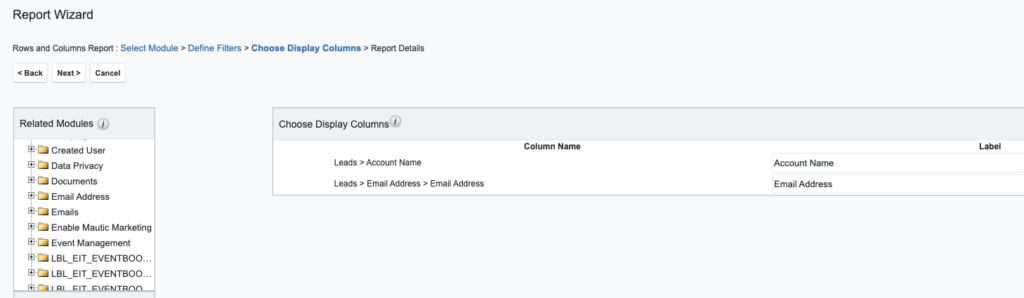
If you’re creating a basic Rows and Columns report, the next step after choosing your filters is to select your display fields. This is when you tell Sugar what fields you want to see in your report.
If you’re creating a marketing target list, you’ll want to see an account/customer name and an email address.
Save and run your report
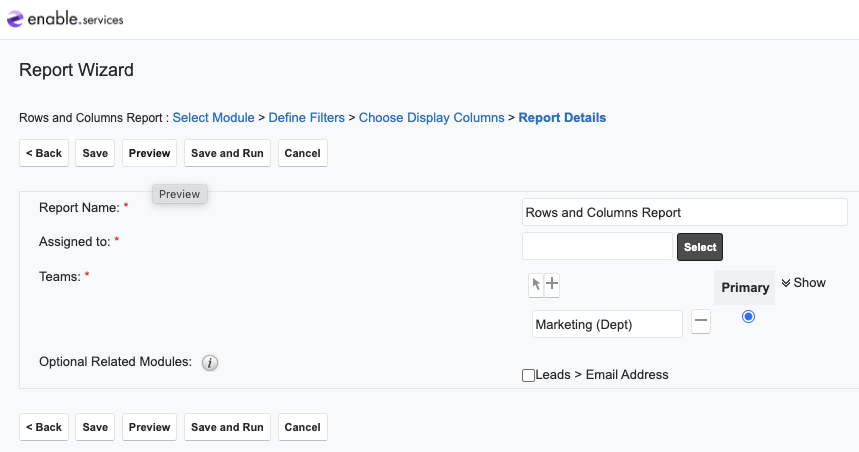
After the first three steps, you’re ready to name and save your rows and column report. Before you press ‘save and run’, the preview option is a great way to double check if the data has pulled through correctly.
Once you save, you’ll be able to see your report in the form of a list, with your chosen display fields as columns. If you ticked the run time box, you’ll be able to see the filter options on the right-hand side ready to be edited.
Summation and Matrix Report Next Steps
Define group by
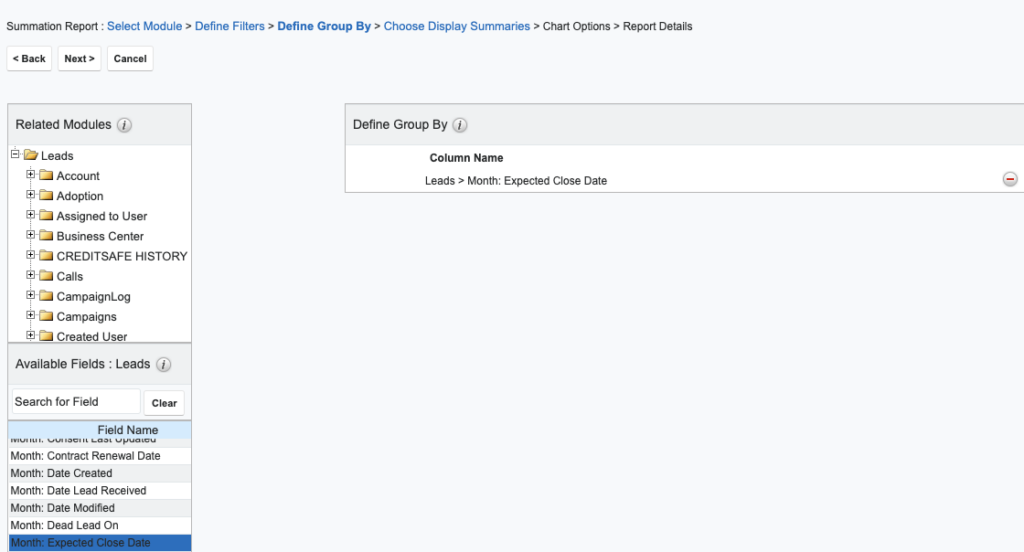
Summation and Matrix reports have the same steps, just different layouts. After you’ve selected your filters and conditions, the next step is to define your group.
Depending on the type of report you’re running, this step highlights how you want to group your data. Do you want to see sales by user to analyse how many leads your team members have converted? Or, do you want to group your opportunities by expected close date? B2C companies could also group their data by products to compare product performance.
Choose your display summary
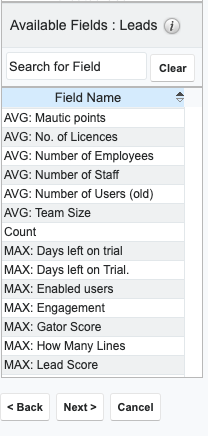
This is where the numbers come in. Whether it’s an average, a minimum or maximum, or a basic sum, you need to tell Sugar’s reporting wizard how you want to display the values.
Perhaps you want to see your average rating score for your customer service team. Or you might want to simply count how many cases you had per month.
Select a chart layout
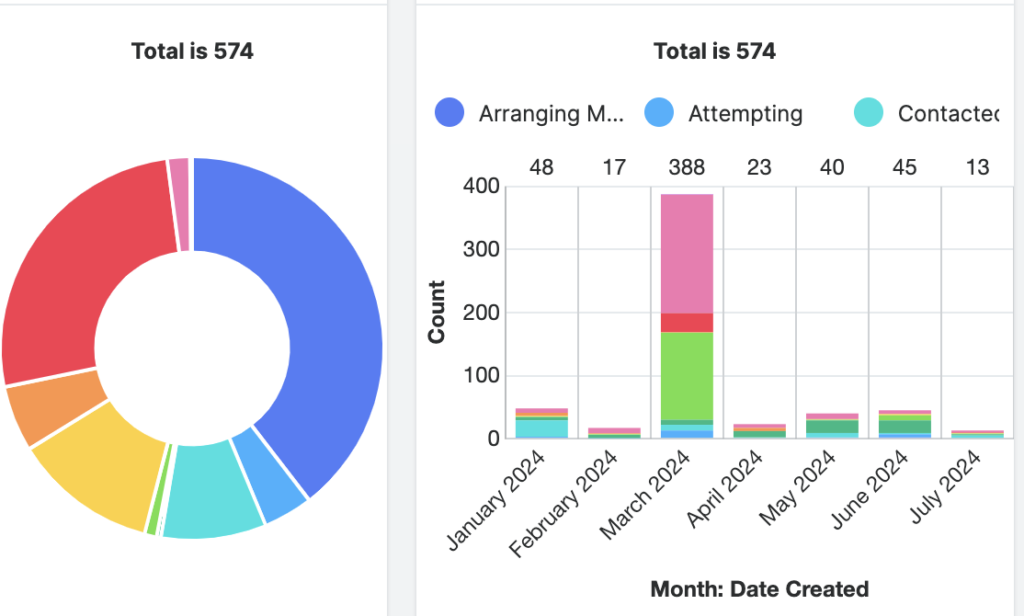
The reporting wizard provides plenty of vibrant chart layouts to choose from. This includes pie charts, bar charts (horizontal and vertical) and colourful treemaps (our personal favourite). If you’re not sure which chart to choose for your specific report, the preview feature is great for testing different displays.
Summation Report with Details Next Steps
Select your display fields
When you choose the Summation with Details report, it only adds one more question and it’s one we’ve covered in the Rows and Columns section. Which fields do you want to be displayed? This could be Account Name, email address, location etc. This will add extra information underneath your chosen chart layout.
At the end of every report, it will always take you to Save and Run, where you can save your report for future use.
How to schedule reports in SugarCRM
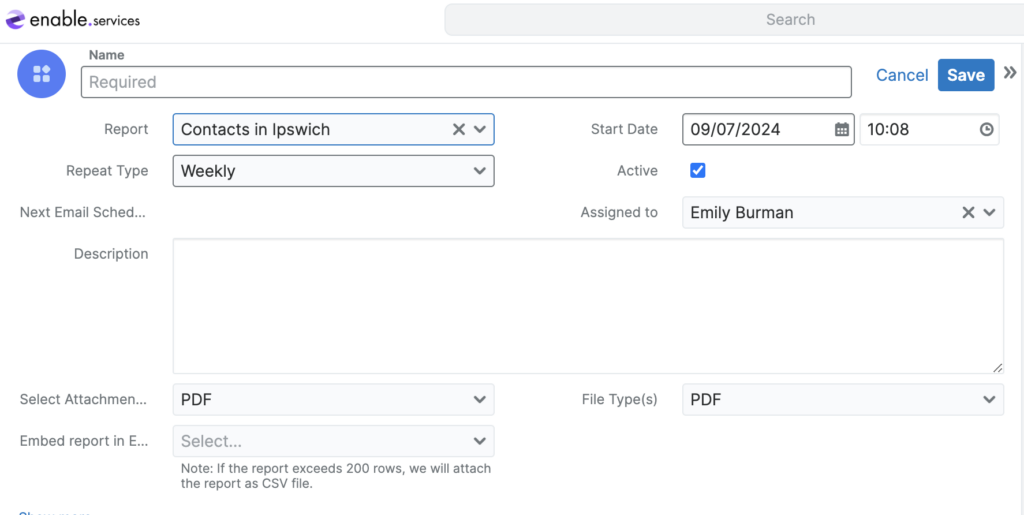
So, you’ve made a report for your department but you want to see the updated data every week, or maybe every month. The report schedules feature gives you the ability to send the report to a team member, or to yourself via email every time period. Follow the steps below to create a reports schedule:
Click 'Reports Schedules' in Action view
Hover over the Reports module in the sidebar, select the three dots and click ‘Reports Schedules”. Or, if you already have your chosen report open, go to ‘Reports Schedules’ in the dropdown on the top right.
Select 'Create'.
Once in the Report Schedules List View, click ‘Create’. It’s time to set up your custom reports schedule…
Name your report schedule
Name your report schedule to whatever you like. This could be “Monthly Sales Report”, “Weekly Cases” or “Product Popularity”.
Select your report
In the dropdown, select the report you want to send every time period. If you opened the Reports Schedules view inside of your report, your report should be selected already.
Choose your start date and time, and repeat type
Select your start date and the time you want to be sent the report every time period. Then, select your repeat time. Sugar provides plenty of options including hourly, daily, weekly, monthly etc…
Choose file type and embed options
Sugar reports are exportable as a CSV (best for Rows and Columns reports), a PDF (best for display charts), or both. Or, you can choose to embed the chart or table directly in the email.
Once done, press Save and your report schedule is good to go!
Extra guidance with reporting on Sugar:
- Struggling with SugarCRM reports? Contact our professional services team for extra assistance and report training.
- Watch our Youtube video on How to Create a Report in SugarCRM to follow along as we go through a sales Summation Report.
- Watch our webinar to go through the top reporting tips with our Sales Director.