
Beginner's Guide to EspoCRM Reports: How to Build List and Grid Reports
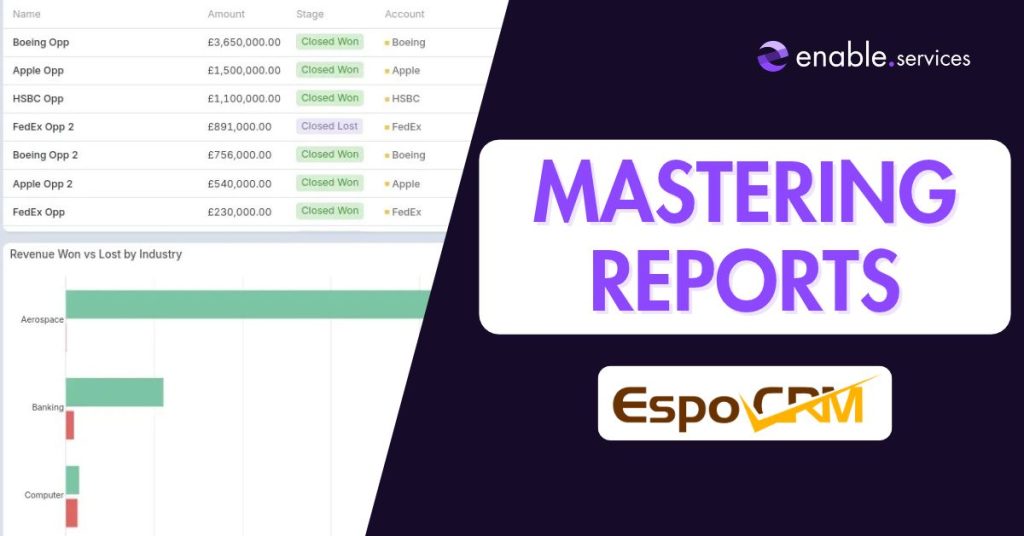
If you are just getting started with EspoCRM, managing day-to-day records—whether they are customer accounts, support cases, marketing leads, or deals—is likely your top priority. But as your CRM database grows, stepping back to analyse performance, track trends, and extract operational metrics becomes essential. That is where EspoCRM Reports come in.
Available through the EspoCRM Advanced Pack, the reporting module allows you to query any entity type across your CRM, build visual dashboards, and turn raw database records into actionable business intelligence. While EspoCRM supports List, Grid, and Joint Grid report structures, most day-to-day business reporting relies on two foundational core types: List Reports and Grid Reports.
In this beginner guide, we will explore how EspoCRM reports work in general, explaining the core concepts step-by-step. To keep things practical and easy to follow, we will walk through a common real-world scenario as our step-by-step guide: tracking sales revenue by industry by connecting Accounts and Opportunities data.
Skip to:
Part 1: Building a List Report (Detailed Record Views)
A List report displays detailed, row-by-row lists of individual records that match your specific criteria. It functions like a smart spreadsheet view embedded directly inside your CRM. You can create List reports for any entity in EspoCRM—such as open support tickets, uncontacted leads, active accounts, or pending tasks.
1. Access the Reports Module & Select Your Entity
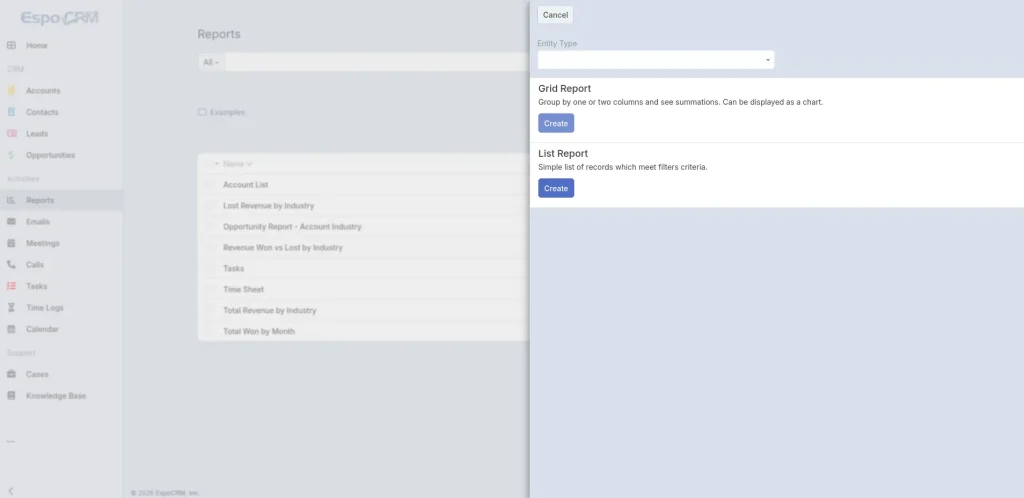
To create a new List report:
- Log in to your EspoCRM System.
- Click on the Reports tab in the main navigation menu.
- Click the Create Report button in the top right corner.
- Choose the target Entity Type you want to report on.
- Select List Report as your report type.
Beginner Tip for Entity Selection: Pick the record type that holds the core data point you want to analyse. For instance, if you want to inspect individual sales deals, select Opportunity as your primary entity.
2. Choose Display Columns & Fine-Tune Layout
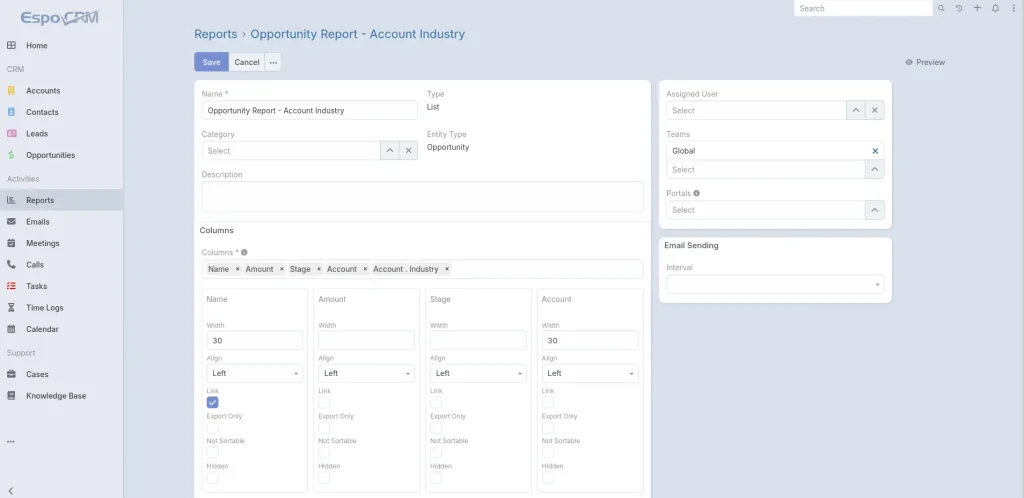
In the Columns field, select the record fields you want to display in your table. EspoCRM lets you pick fields from the primary entity as well as fields from related records. In our example, you can select Opportunity fields (like Name, Amount, and Stage) alongside related Account fields (such as Account Industry).
Underneath each selected column, you can customise display parameters:
- Width: Define column width as a percentage. If left blank, the columns will automatically use the remaining width equally.
- Align: Set text alignment to Left or Right (recommended for numeric/currency fields).
- Link: Enable this option to turn field values into clickable links leading straight to the record’s detail page.
- Export Only: Keep the column hidden on screen while including it in CSV/XLSX downloads.
- Hidden: Keep the column hidden by default while allowing users to toggle it visible in the result view.
3. Set Sorting, Filters & Runtime Filters
To ensure your report focuses on relevant records, apply sorting and filtering rules:
- Order: Choose how to sort your records (e.g., sorting by Amount descending to see largest deal values at the top).
- Runtime Filters: Mark specific fields as Runtime Filters. This allows users to adjust filter parameters dynamically (such as selecting date ranges or specific industries) on the fly without changing the report setup.
- Standard Filters: Add fixed conditions using logical AND/OR criteria (e.g., Stage Equals Closed Won or Account Industry Equals Technology).
4. View, Export & Use List Reports
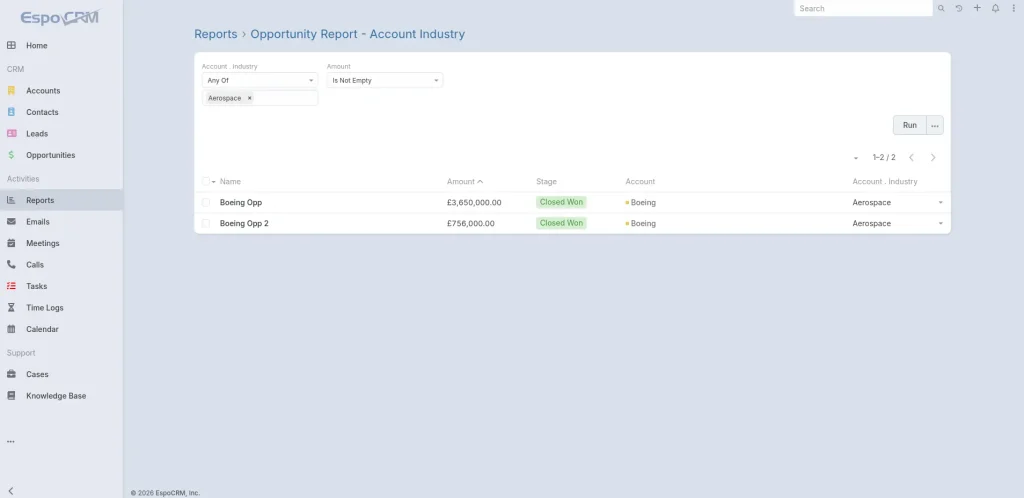
Once saved, click Results View (top right) to view your list. EspoCRM offers several ways to utilise List report results across your system:
- Spreadsheet Export: Export List report data directly to CSV or XLSX formats for external analysis from the results view.
- Dashboards: Use Report Dashlets on a dashboard to display results based on a selected report.
- Report Panels: Create a report Panel in the admin section to display results on the side view when viewing records.
- Target Lists: Build a Target List dynamically from a selected report to help marketing teams target specific contacts.
Part 2: Building a Grid Report (Summarised Totals & Charts)
While a List report gives you individual record rows, a Grid report aggregates numerical values into summarised metrics. Instead of listing every individual item, Grid reports group data into categories and calculates totals, averages, or counts making them ideal for summaries and visual charts.
1. Access Grid Report Setup
Creating a Grid report follows the same initial navigation steps as a List report: go to Reports > Create Report, choose your primary Entity Type (e.g., Opportunity), and select Grid Report as your report structure.
Filter & Navigation Note: Grid reports use the exact same Standard Filters and Runtime Filters as List reports (explained in Step 3). You can filter Grid reports by date range, stage, or owner using the same runtime controls.
2. Configure Aggregate Functions & Grouping
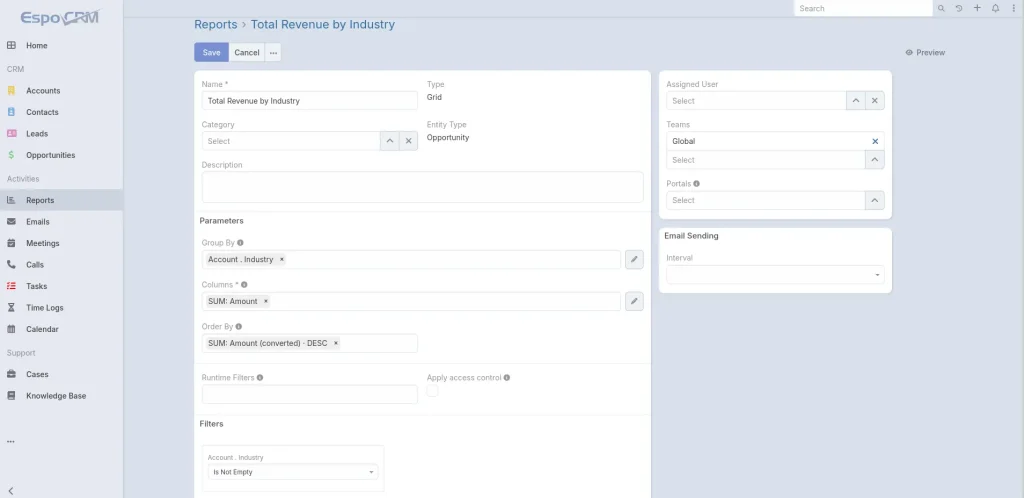
In a Grid report, instead of selecting plain record columns, you define aggregate functions and grouping categories:
- Group By: Select one or two fields you want your report to be grouped by. For date fields it is possible to apply additional grouping by period such as Year, Quarter or Month and more.
- Columns: In a Grid report you can select aggregate functions applied to a specific field, such as Count, Sum, Min, Max or Avg. This is particularly useful for reporting on Total Revenue by Industry like in our example.
- Order By: Sort summary rows so your highest-value categories appear at the top.
3. Add Visual Charts (Unique to Grid Reports)
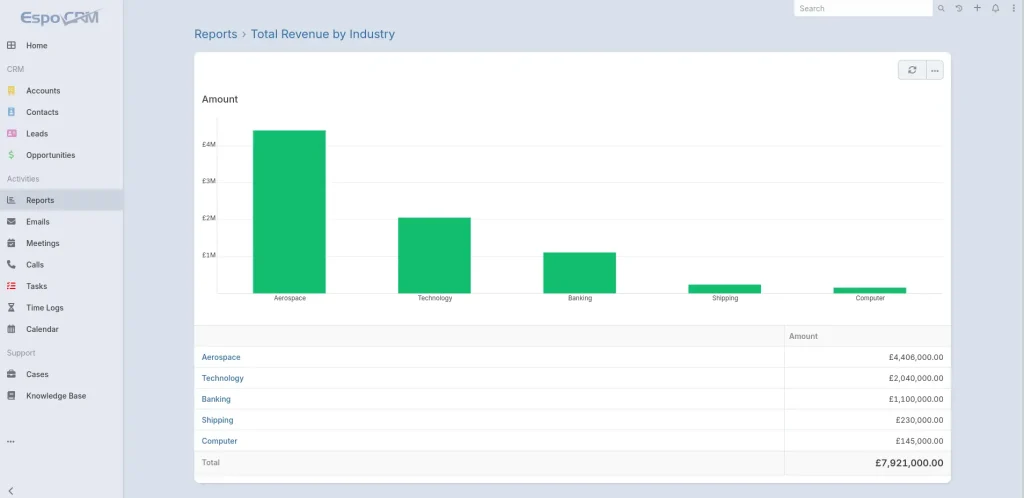
The most powerful feature unique to Grid reports is built-in data visualisation. EspoCRM automatically converts your summary tables into visual charts:
- Bar Chart (Horizontal or Vertical): Ideal for comparing categorical totals (like total revenue by industry) side-by-side.
- Pie Chart: Great for visualising proportional share across categories.
- Grouped Bar Chart: Used for two-dimensional grouping to compare sub-categories side-by-side.
- Line Chart: Best for tracking trends over time (such as monthly or quarterly growth).
4. Exporting & Displaying Grid Reports
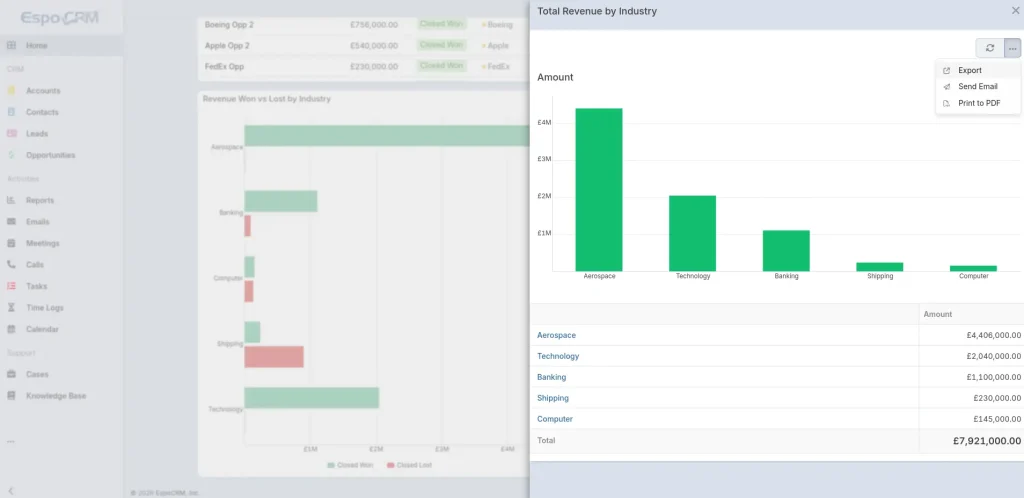
Sharing Grid reports builds on the core sharing mechanisms outlined earlier:
- XLSX Export with Charts: Exporting a Grid report to XLSX automatically exports both the data table and the embedded chart into the spreadsheet.
- Dashboard Dashlets: Place Grid charts directly onto user dashboards using the Report dashlet for real-time visibility.
- Report Panels (admin): Embed summary charts directly onto Account or Contact detail views.
Summary & Next Steps
Mastering EspoCRM Reports is the easiest way to turn daily CRM records into clear business insights across every department. Whether you need a List report to inspect detailed records or a Grid report complete with pie and bar charts to track overall performance, EspoCRM provides a flexible, robust reporting engine.
Need guidance setting up custom EspoCRM reports, creating sales dashboards, or optimising your CRM workflow? Contact the enable.services team today to see how our CRM experts can assist you!