What's new to Mautic version 5?

With updates comes exciting new features, more ways to send communications to your customers and better ways to measure the success of campaigns through improved statistics. Or at least that’s what has come with Mautic’s version 5.0 update which was released a few weeks ago.
The new version offers a handful of fresh features alongside some more enhanced features, some of which have been identified as being potentially the most helpful when it comes to an end user. Even someone new to Mautic will be impacted by these features when carrying out regular tasks such as creating campaigns and reviewing key statistics.
Let's take a look at Mautic’s most impactful new features
Email click heat maps
Firstly, the new email click heat map provides a visual representation of which areas of an email have received the most clicks. With this feature, you’re able to view which links perform the best across the page layout and use the information to place your links in the best place to improve your click-through rate.
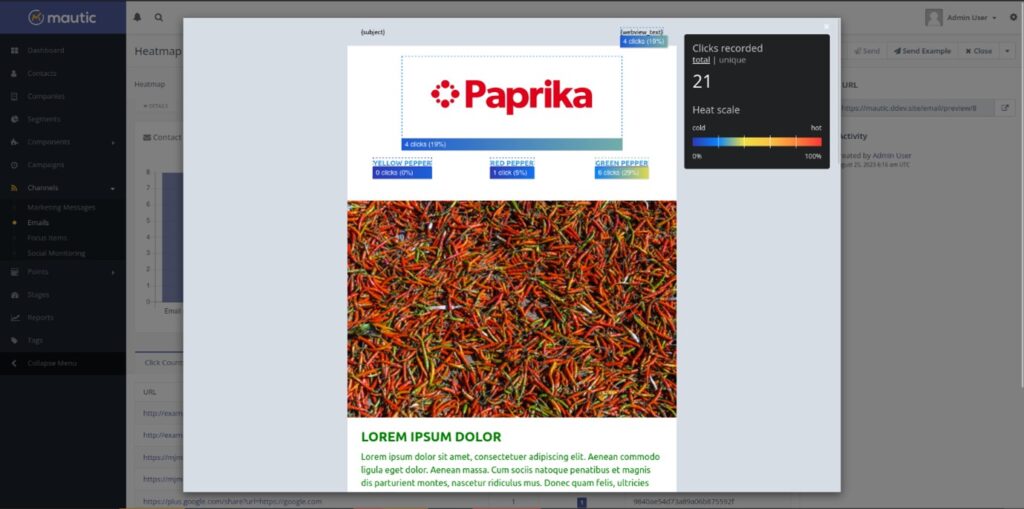
In this example, “GREEN PEPPER” has done the best with 29% of the total clicks from the email, showing in yellow highlighting (warm link) compared to “RED PEPPER” which has only 5% of clicks, showing in blue highlighting (cold link). As you can see, the clear highlighting visual coupled with the heat scale of the side of the email makes it easy to distinguish which links are performing well and which ones are not. This helps you plan for future campaigns and improve link placements based on your results.
Point groups
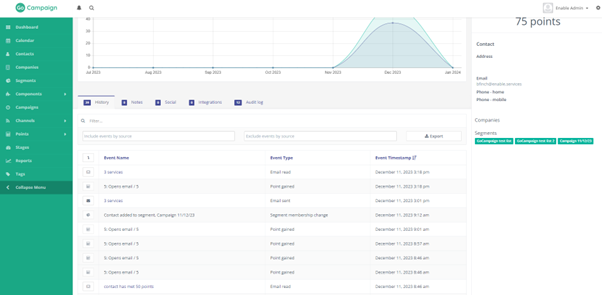
The other newest feature which is bound to improve the user experience is point groups. Point groups allow you to collect certain point actions and place them into a group.
A point action is when a contact gains points from completing a predefined action. For example, when a contact opens an email or visits a specific URL, this is a point action. Groups give you real flexibility when it comes to scoring your contacts, allowing you to use them in segments and campaigns. Groups also display on a contact’s profile, allowing for even deeper analytics on contacts and their engagement with your marketing efforts such as webpages and contact forms.
What’s been enhanced?
Statistics Tab
Alongside the new features, there have also been some features which have been enhanced. Let’s go through the ones that might improve user experience the most.
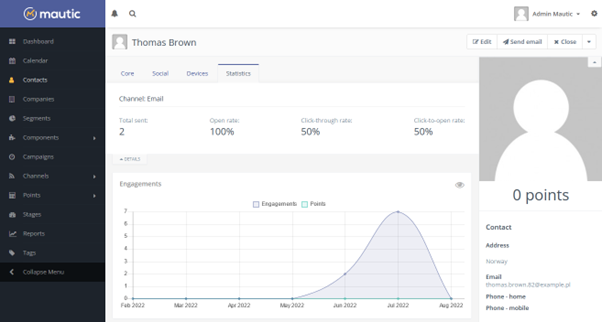
One of these features is viewing a contacts email statistics in the contact view. Before the version 5 update, you could only view if a contact had opened emails by scrolling through the activity list on their profile. Sometimes a contact receives and interacts with hundreds of emails making it difficult to gather an understanding of their engagement. Scoring could be considered an exception to this however, even if a contact has a high score it might not mean that they interact with your emails.
So, what’s the solution? With the new update, when drilling down into a specific contact, there is a new “Statistics” tab which shows total emails sent to that contact (along with open rate, click-through rate and click-to-open rate) allowing you to view a detailed overview of how much a contact is engaging with your content. Not only does this feature allow you to see more detailed information about your marketing efforts, but it also links with the new heat map feature so that you can see what has a better impact on your target audience.
Contact’s email engagement
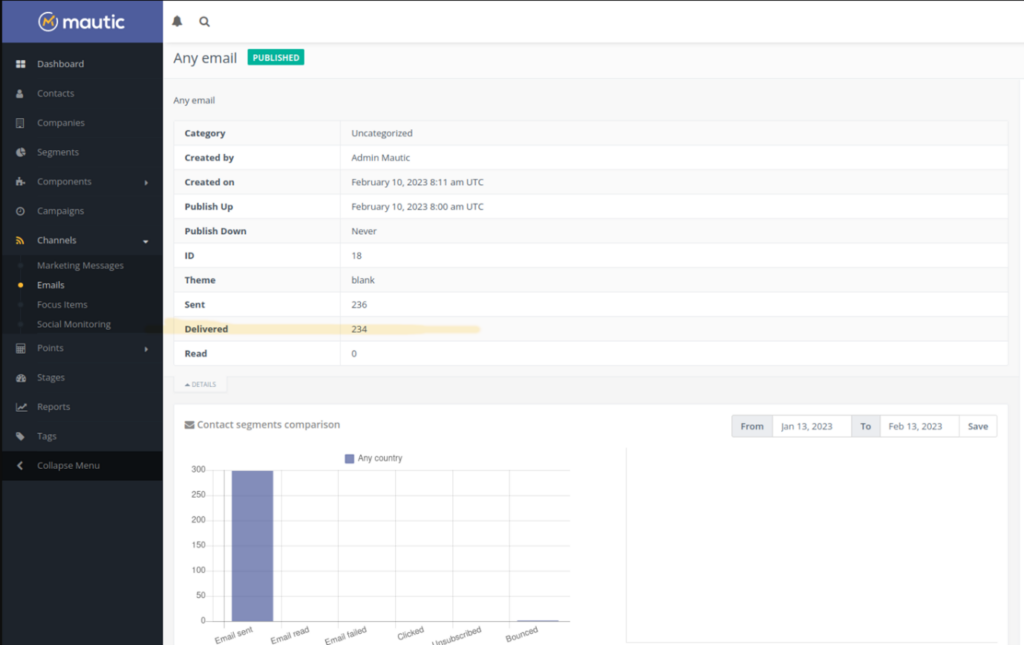
Another useful enhancement has been added in the form of a new column which is available on a selected email page. Simply click the details tab at the top to see a dropdown of information which displays how many emails have been successfully delivered, offering the security of knowing that communications have not been lost or denied in transit to your intended recipients.
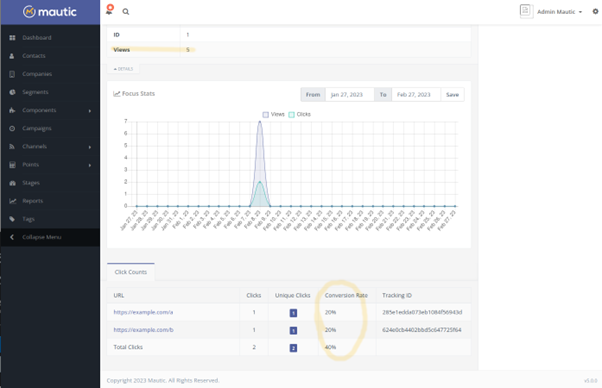
Focus item conversion rate view
The final enhanced feature is the focus item conversion rate view. Focus items allow you to engage users on your website through the use of bars, notifications and website pop-ups. The aim of focus items is to encourage users to interact with your marketing by filling out a form or submitting their details so that your business generates conversions. With the new view, you’re able to see your list of focus items with their conversion rates, showing you what type of focus items are giving you the best results and which ones are not performing.
Those were just a few of the new and enhanced features which were released in the recent version 5 update to Mautic. You can read the full release notes here. If this looks like something you or your company would be interested in, don’t hesitate to contact us here at enable.services for a free 1-hour consultation.
Contact us through:
· Email – info@enable.services
Or pick up the phone and give us a call on 01473 618980. One of our team members will be more than happy to help you begin on your path to marketing automation using our in-house solution powered by Mautic, GoCampaign.